ANSWER SCHEME
Section A
Answer either Question 1 or Question 2 from this section.
1
|
A group of students were investigating tourists’ impression of Singapore’s Chinatown. Fig. 1 is a map of Chinatown.
| |
Map of Chinatown
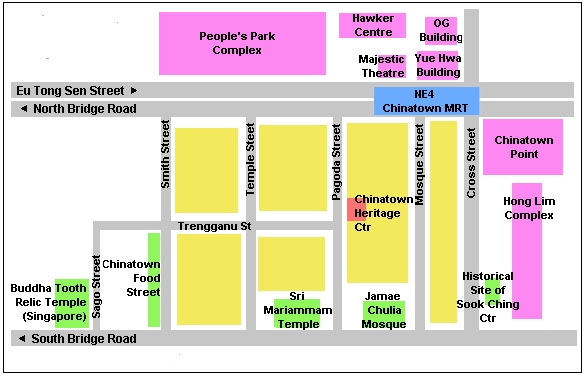
Fig. 1
| ||
(a)
|
The students devised a bipolar survey and asked 20 tourists to complete it.
Using Fig. 1, suggest and justify a possible site in Chinatown where the students could conduct the survey. [2]
Location – 1 mark
Reason – 1 mark
| |
(b)
|
Describe a sampling technique for conducting the bipolar survey and explain how this is administered. [3]
Note : Cannot use subgroups or random sampling method as the traffic flow is high. Therefore most logical method is by sampling
| |||||||||||||||||||||||||||||||||||||||||||
(c)
|
Study Fig. 2 which shows the results of tourists’ impression of Chinatown.
Bipolar survey on tourists’ impression
Fig. 2
Complete the bipolar graph using data from Fig. 2. The first two environmental factors have been drawn for you as an example. [3]
| |||||||||||||||||||||||||||||||||||||||||||
(d)
|
Does the data from Fig. 2 and bipolar graph support the hypothesis ‘Tourists have a positive impression on Singapore’s Chinatown’? Give reasons for your answer. [4]
1st point + Any 3 other points. Accept any plausible data as answer
| |||||||||||||||||||||||||||||||||||||||||||
| Note: Well answer by Armin! | ||||||||||||||||||||||||||||||||||||||||||||
(f)
|
Provide one suggestion to improve the reliability of the investigation. [1]
Note: Many students do not understand 'reliability'. it means how to make the data collected to be more accurate.
| |||||||||||||||||||||||||||||||||||||||||||
[Total: 13 marks]
2
|
Some students in Sydney, Australia were investigating local weather conditions. Fig. 3 is a map of an area in Sydney showing the possible sites to collect weather data and the results of their weather measurements are shown in Fig. 4.
Possible sites of collecting weather data
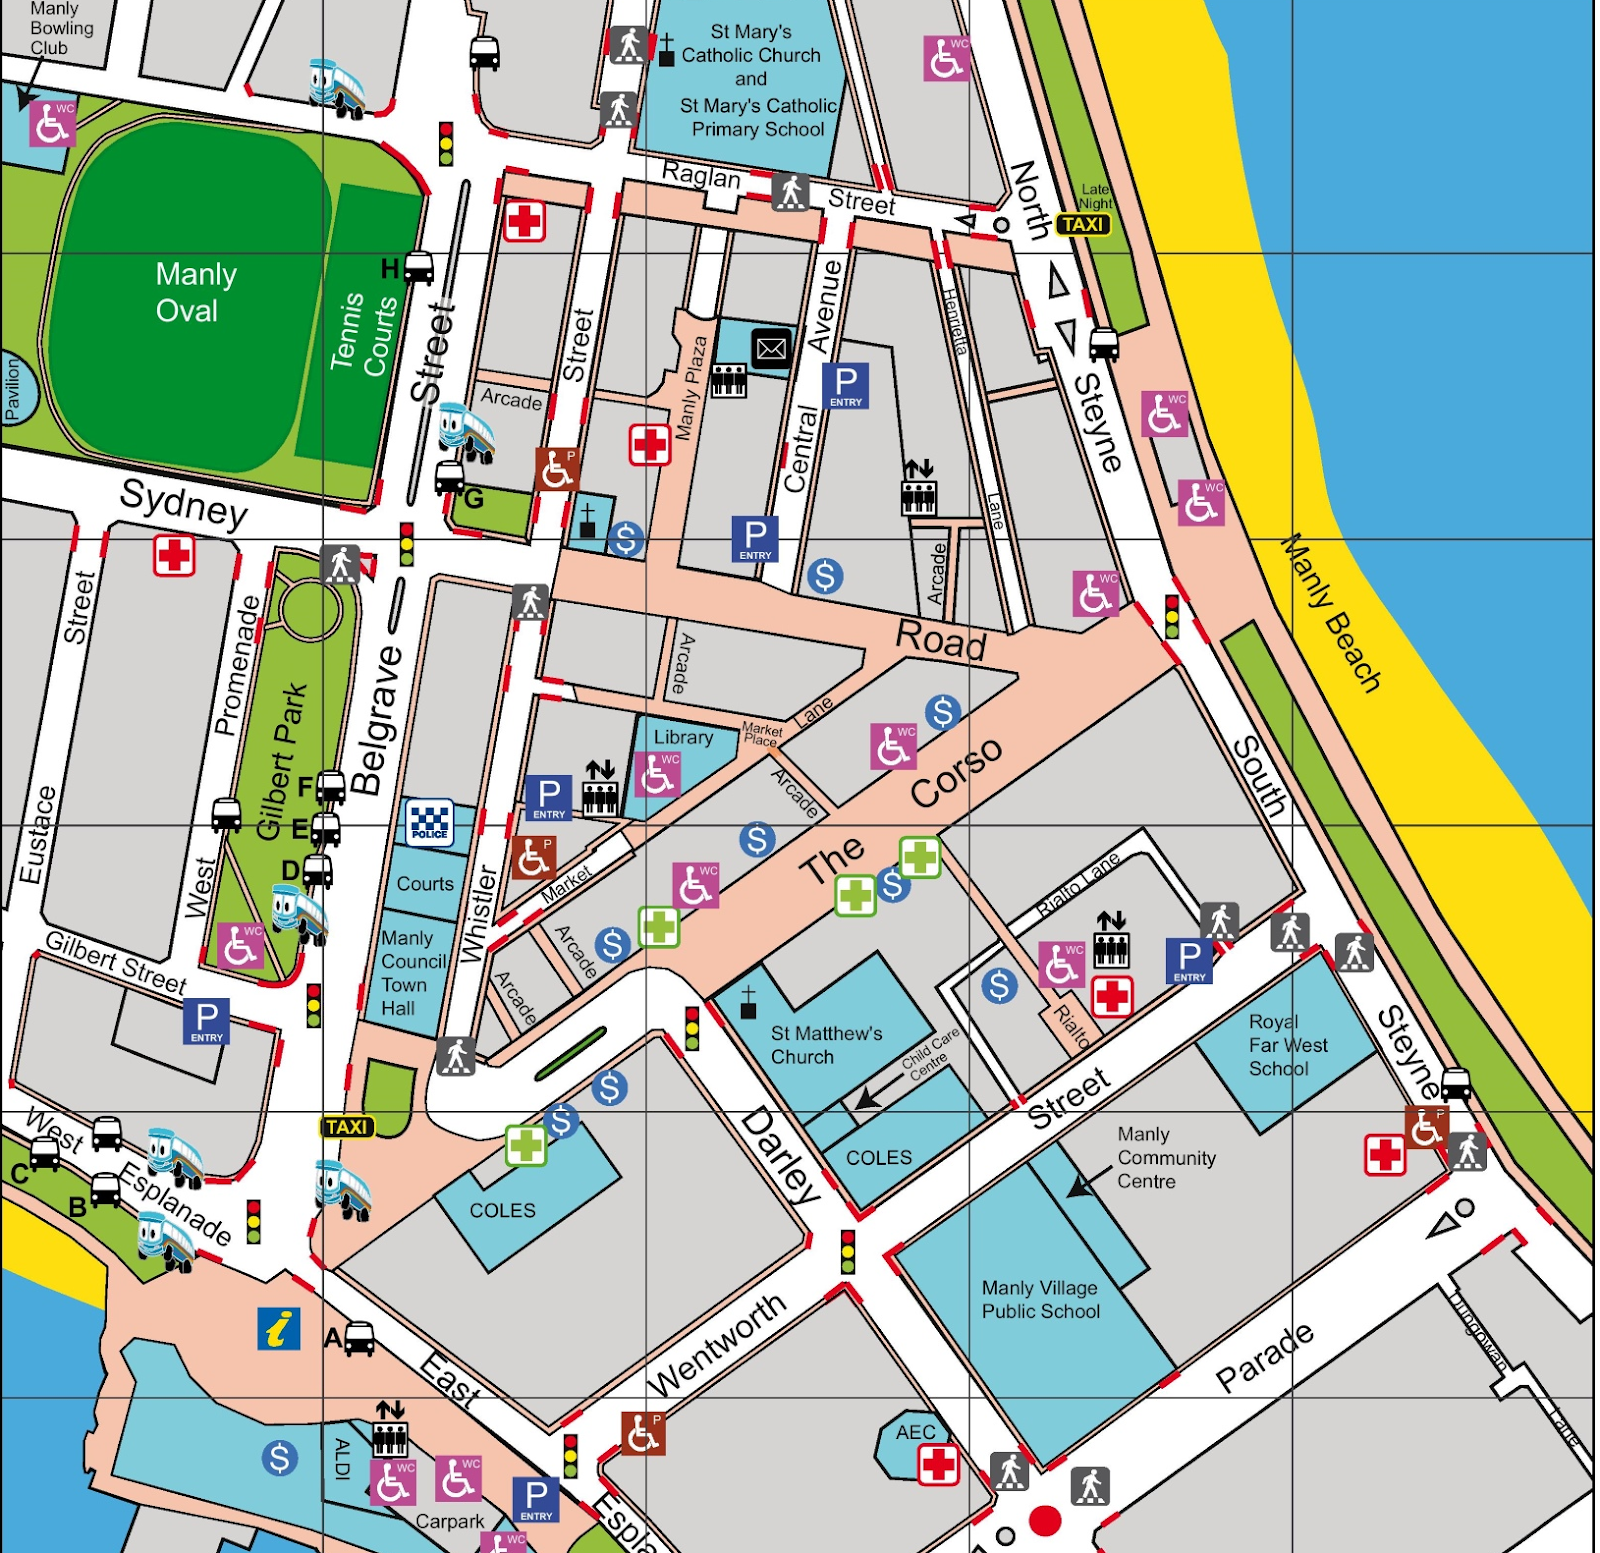 
Fig. 3
Results of weather data collected
Fig. 4
| |||||||||||||||||||||||||||||||
(a)
|
Which site, A, B or C, is the most suitable to collect weather data. Justify your answer. [2]
| |||||||||||||||||||||||||||||||
(b)
|
The students decided to use a sling psychrometer to collect data on humidity. Describe the procedures they would take to obtain accurate readings of the wet-bulb temperature. [3]
Note: Its WICK! not WIG!
| |||||||||||||||||||||||||||||||
(c)
|
Complete the bar and line graph using data from Fig. 4. Data for Day 1 and 5 have been plotted for you as an example.
Temperature and precipitation of an area in Sydney, Australia
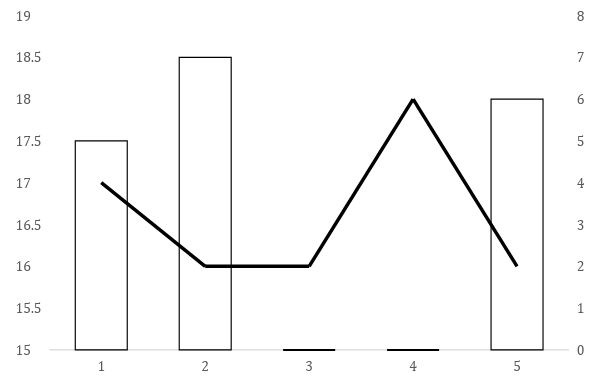
[3]
| |||||||||||||||||||||||||||||||
(d)
|
Using evidence from Fig. 4, state if the guiding question ‘Does wind speed affect humidity? Is answered. Give reasons for your answer. [4]
Accept other data as answers.
| |||||||||||||||||||||||||||||||
(e)
|
Provide one suggestion to improve the reliability of the investigation. [1]
| |||||||||||||||||||||||||||||||
[Total: 13 marks]
Section B
Answer Question 3 from this section.
3
|
Study Fig. 5, a map which shows a town in Norway.
Town map of Geiranger, Norway
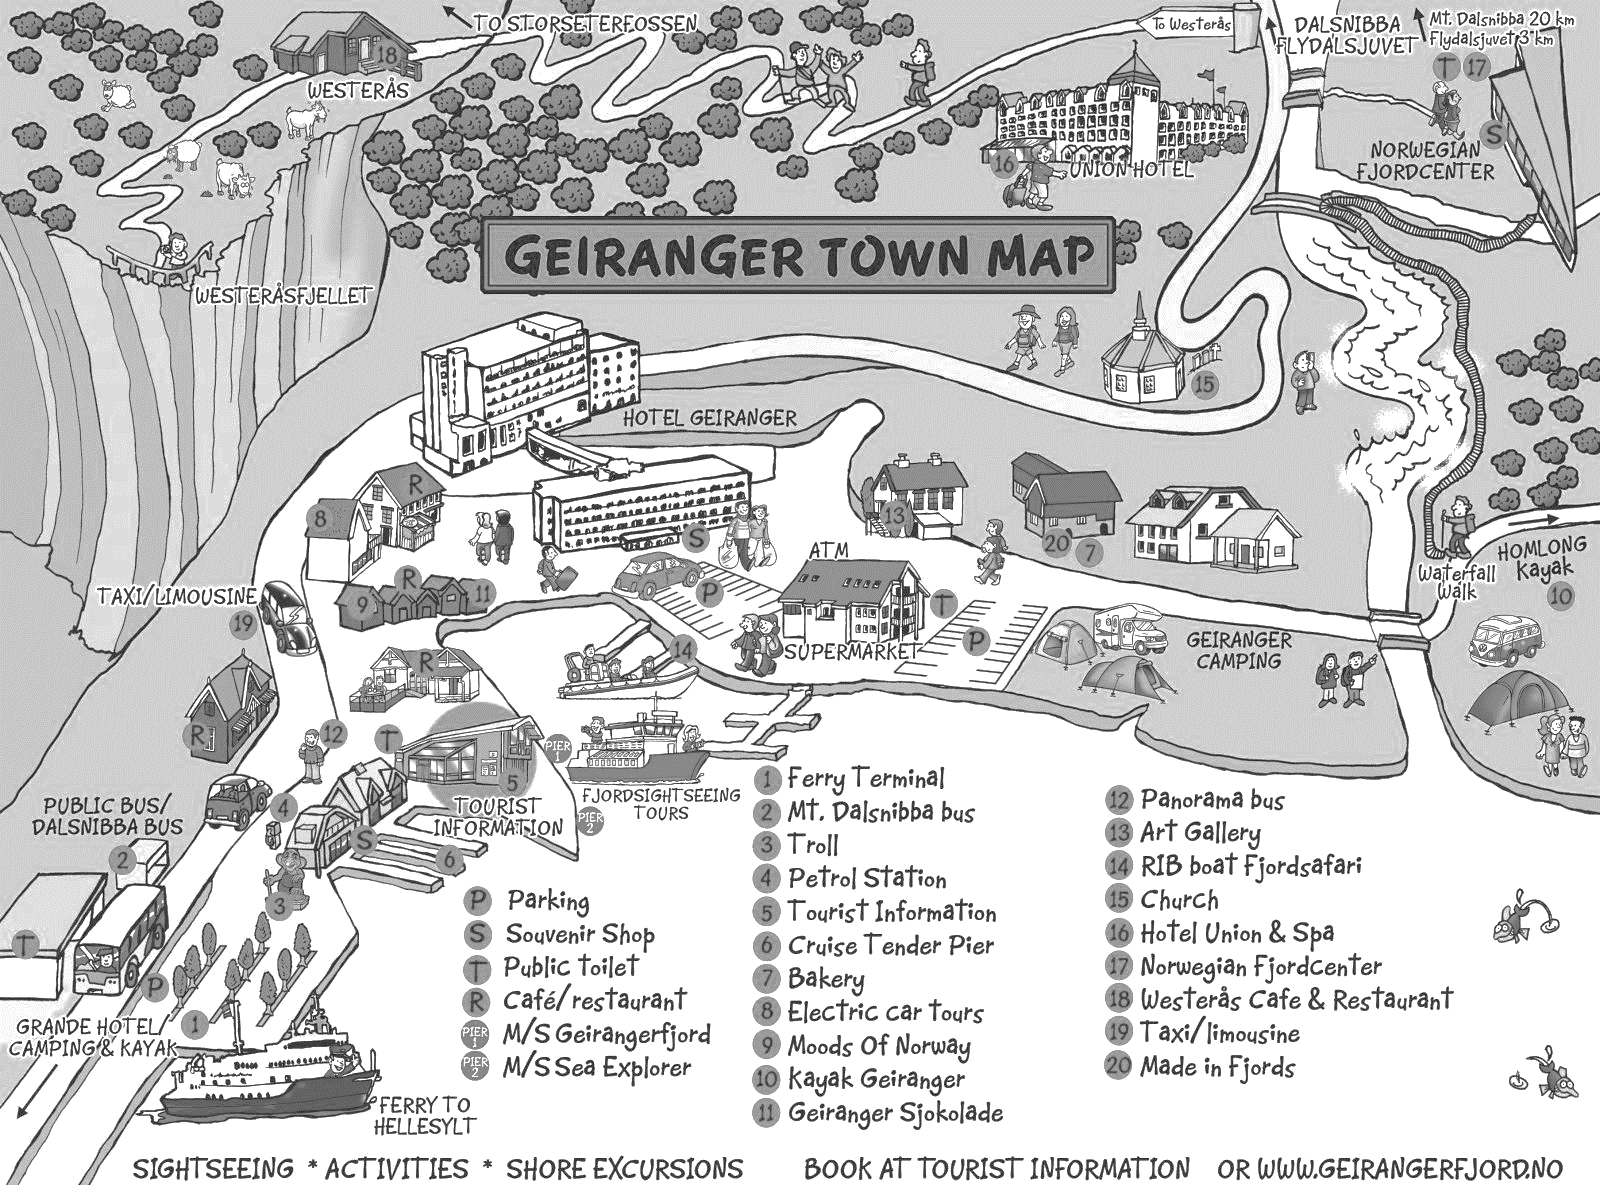
Fig. 5
| ||
(a)
|
Using evidences from Fig. 5, describe what might attract tourists to the area. [3]
Accept any plausible answer.
There must be at least 1 specific example in answer to obtain full marks. Must also mention three categories of attractions eg recreational, infrastructure, accommodatino etc.
| ||
(b)
|
Study Fig. 6, which shows the number of China’s tourist arrivals and the country’s growth rate.
Number of inbound tourist arrivals and country’s growth rate in China

Fig. 6
Using Fig. 6, describe the relationship between the number of China’s inbound tourist arrivals and its growth rate from 2011 and 2016. [3]
Note : Must provide DATA
| ||
(c)
|
‘Global economic recession is a main cause of fluctuations in the tourism industry.’
How far do you agree with this statement?
Give examples to support your answer.
Candidates may consider the following causes of fluctuations in tourism:
Global Economic Recession
Disasters
Political situations
Diseases
Candidates at each level will show the following characteristics:
Level 1 (0 - 2 marks)
At this level answers will be generalized or with minimal support if any stand were given at all.
Reasoning rather weak and expression may be unclear.
A basic answer that has little development.
Award L1/1 for answer limited to simple listing of one or two cause.
Award L1/2 for answer with description of one or two cause.
Level 2 (3 - 4 marks)
Disagreement and agreement will be supported by appropriate detail.
Or, both agreement and disagreement are considered, but support is patchy so that the answer is not full.
Good reasoning and logic in parts of the answer with good expression in places.
Award L2/3 for answer with balanced evaluation of two causes or one cause with example.
Award L2/4 for answer with balanced evaluation of two causes with at least ONE example given.
Level 3 (5 - 6 marks)
At this level answers will be supported by sound knowledge.
Both agreement and disagreement are considered and well supported.
Reasoning is clear and logical with good expression of language.
Award L3/5 for answer with balanced evaluation of two causes with examples.
Award L3/6 for answer meeting requirements for L3/5 and a good conclusion.
| ||
Section C
Answer either Question 4 or Question 5 from this section.
4
|
(a)
|
Study Fig. 7, a diagram of convection current currents driving the movement of plates.
On the diagram locate, using the appropriate letter, the following:
An example, oceanic ridge (E), has been completed for you.
Convection current

Fig. 7
[4]
|
(b)
|
Explain how convection current causes the formation of arc of islands. [4]
Good answer : Tasmin | |
(c)
|
Study Fig. 8, which shows an area in in southern Taiwan which was damaged by an earthquake.
Damaged caused by earthquake in southern Taiwan
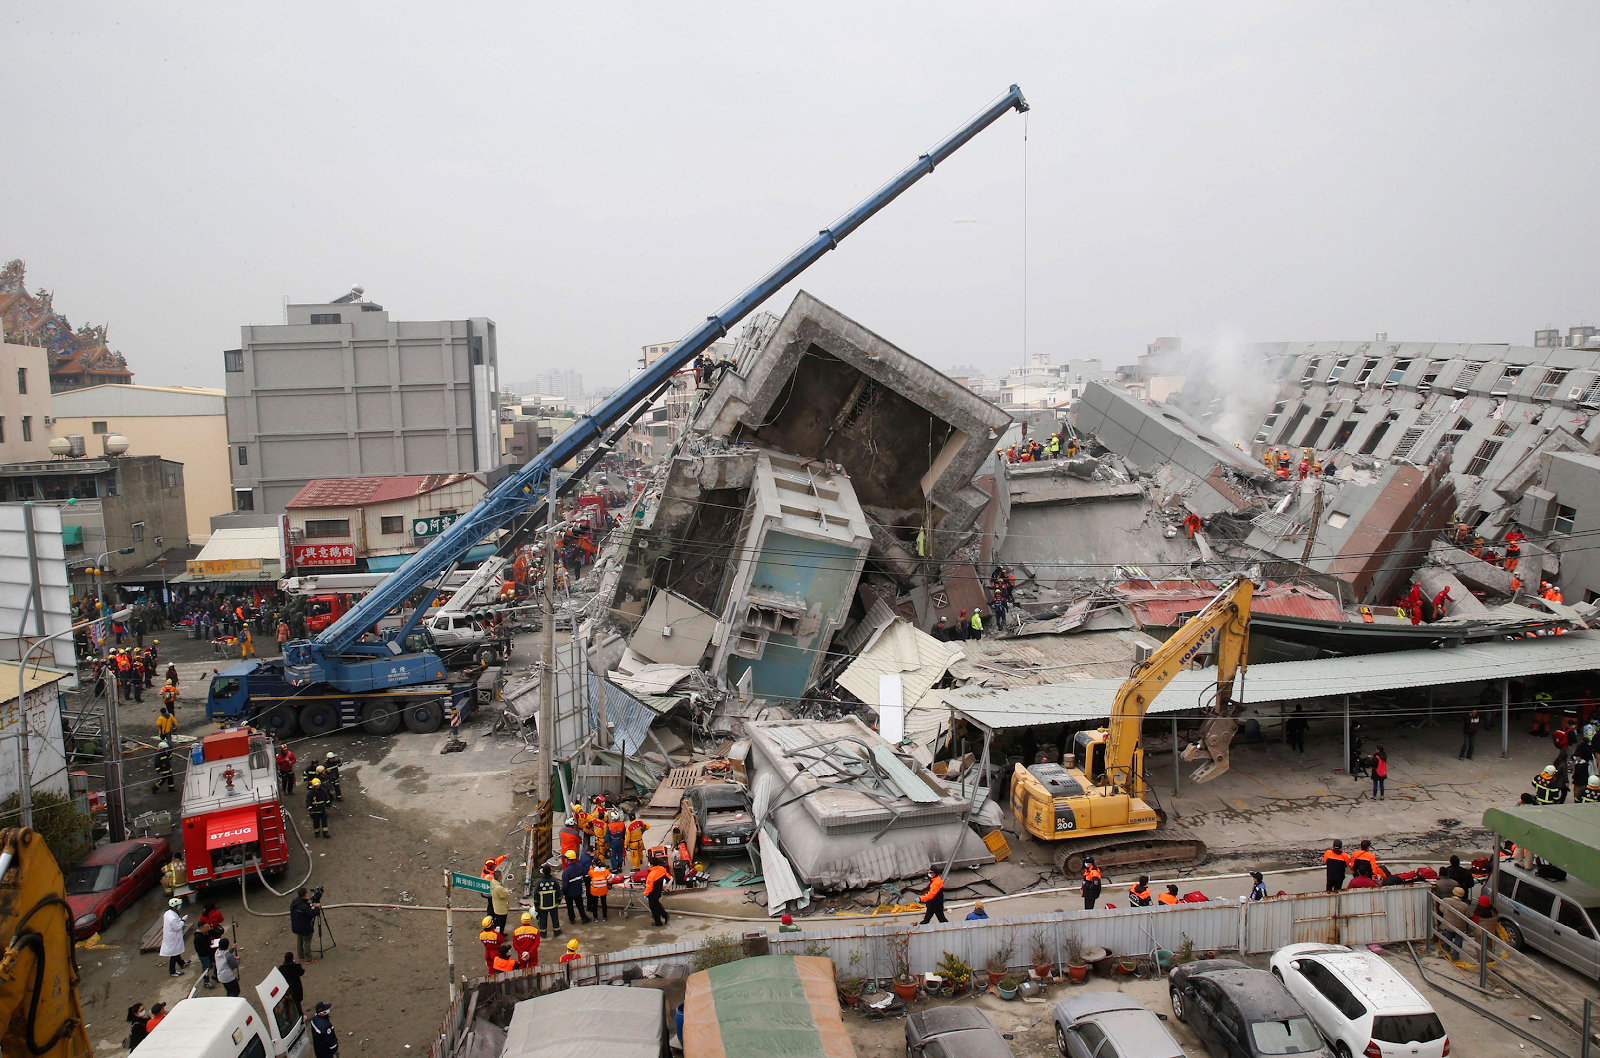
Fig. 8
With the help of Fig. 8, describe the risks experienced by the people living in earthquake zones. [3]
Any 3 of above / Accept other plausible answer
| |
(d)
|
Explain how latitude affects temperature. [4]
OR
| |
(e)
|
Using an annotated diagram, describe how the presence of cloud cover causes a cooler day temperature. [4]
| |
1 m
| ||
(f)
|
‘Climate change only impacts the environment.’
How far do you agree with this statement?
Provide examples to support your answer.
Good answers : Phoebe, Shuwen!
Candidates may consider the following impacts of climate change:
Environment Impacts
Social Impacts
Economic Impacts
Candidates at each level will show the following characteristics:
Level 1 (0 - 2 marks)
At this level answers will be generalized or with minimal support if any stand were given at all.
Reasoning rather weak and expression may be unclear.
A basic answer that has little development.
Award L1/1 for answer limited to simple listing of one or two impact.
Award L1/2 for answer with description of one or two impact.
Level 2 (3 - 4 marks)
Disagreement and agreement will be supported by appropriate detail.
Or, both agreement and disagreement are considered, but support is patchy so that the answer is not full.
Good reasoning and logic in parts of the answer with good expression in places.
Award L2/3 for answer with balanced evaluation of two impacts or one impact with example.
Award L2/4 for answer with balanced evaluation of two impacts with at least ONE example given.
Level 3 (5 - 6 marks)
At this level answers will be supported by sound knowledge.
Both agreement and disagreement are considered and well supported.
Reasoning is clear and logical with good expression of language.
Award L3/5 for answer with balanced evaluation of two impacts with examples.
Award L3/6 for answer meeting requirements for L3/5 and a good conclusion.
|
[Total: 25 marks]
5
|
(a)
|
Study Fig. 9, which shows the relationship between air temperature and relative humidity.
Relationship between air temperature and relative humidity
Fig. 9
Using Fig. 9, describe the relationship between air temperature and relative humidity. [4]
|
(b)
|
Explain how a large water body is able to influence the seasonal temperature of an area. [3]
| |
(c)
|
Study Fig. 10, which shows a synoptic chart of Australia during July.
Synoptic chart of Australia in July

Fig. 10
State the monsoon wind experienced and explain why most of the southern part of Australia experienced rainfall.
| |
(d)
|
Fig. 11 shows the greenhouse effect.
Add annotations to Fig. 11 to explain how greenhouse effect keeps the earth warm. [4]

Greenhouse effect
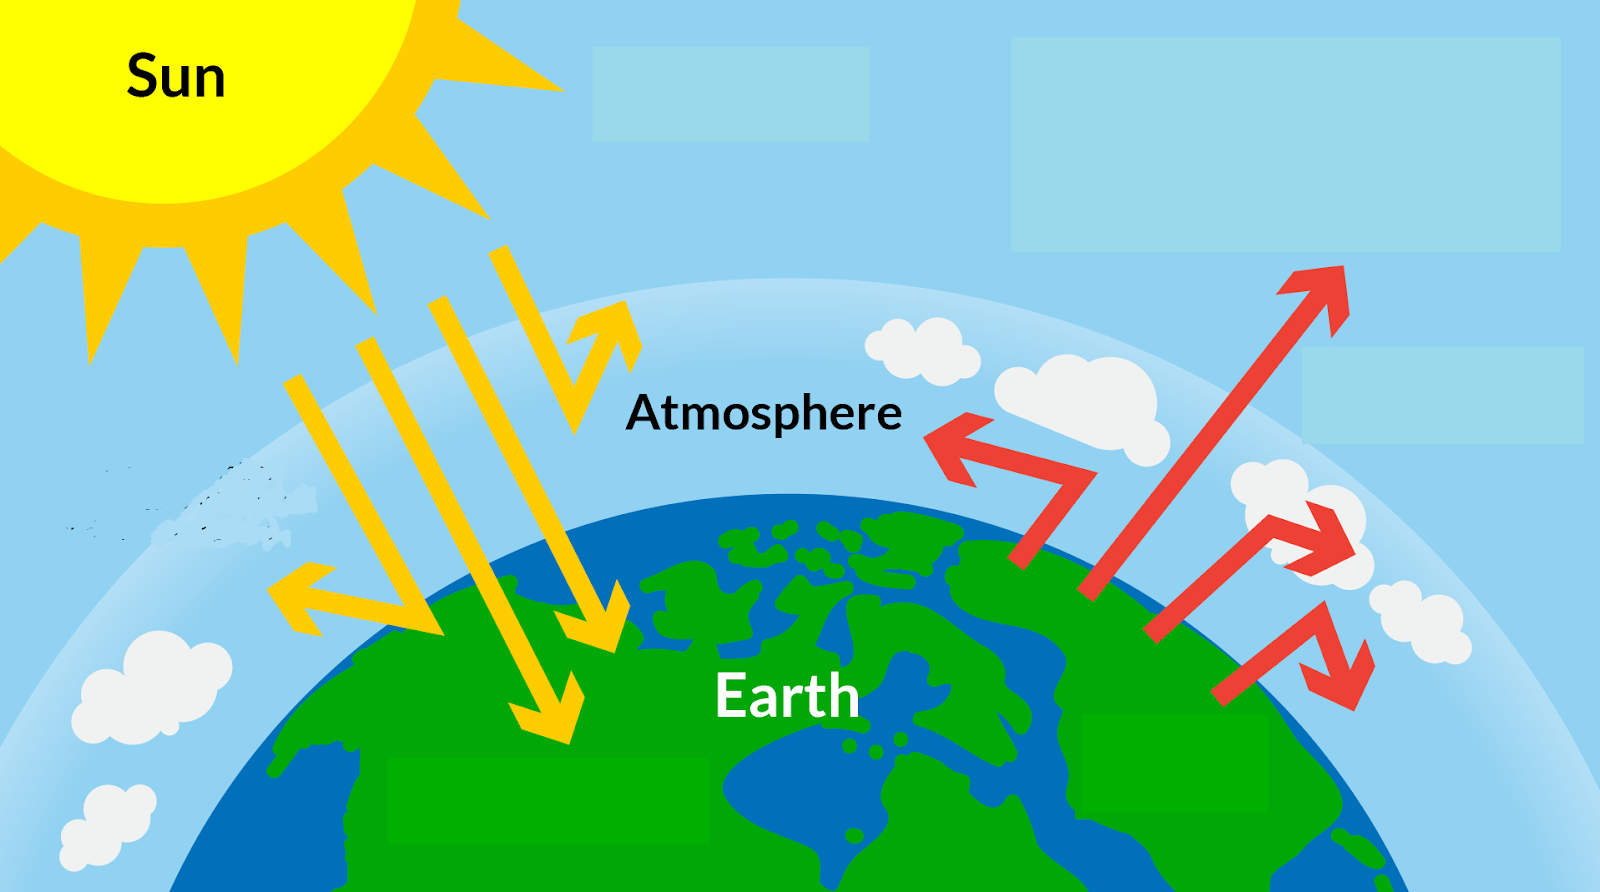
Fig. 11
| |
(e)
|
Explain how deforestation contributes to increased concentrations of greenhouse gases. [4]
OR
| |
Good answer : Xuan Chan | ||
(f)
|
‘Climate change only impacts people.’
How far do you agree with this statement?
Provide examples to support your answer.
Candidates may consider the following impacts of climate change:
Social Impacts
Environmental Impacts
Economic Impacts
Candidates at each level will show the following characteristics:
Level 1 (0 - 2 marks)
At this level answers will be generalized or with minimal support if any stand were given at all.
Reasoning rather weak and expression may be unclear.
A basic answer that has little development.
Award L1/1 for answer limited to simple listing of one or two impact.
Award L1/2 for answer with description of one or two impact.
Level 2 (3 - 4 marks)
Disagreement and agreement will be supported by appropriate detail.
Or, both agreement and disagreement are considered, but support is patchy so that the answer is not full.
Good reasoning and logic in parts of the answer with good expression in places.
Award L2/3 for answer with balanced evaluation of two impacts or one impact with example.
Award L2/4 for answer with balanced evaluation of two impacts with at least ONE example given.
Level 3 (5 - 6 marks)
At this level answers will be supported by sound knowledge.
Both agreement and disagreement are considered and well supported.
Reasoning is clear and logical with good expression of language.
Award L3/5 for answer with balanced evaluation of two impacts with examples.
Award L3/6 for answer meeting requirements for L3/5 and a good conclusion.
|
[Total: 25 marks]
END OF ANSWER SCHEME
